What's New in Playwright v1.59.0, v1.59.1 and v1.60.0

2026-08-26 09:00:11 UTC
Playwright could already record videos through the recordVideo option on browser.newContext(), which saves a separate video per page, each covering that page's whole lifetime with no way to start or stop on demand. The new page.screencast API adds precise, per-page control: we start and stop recording whenever we want, and we can add extras like labels and chapter titles.
Record a video with a clear start and stop:
await page.screencast.start({ path: "video.webm" });
// ... do stuff ...
await page.screencast.stop();
start() takes a few useful options: path (where to save the video), size (the video dimensions), quality (image quality) and onFrame (a callback for raw frames, covered below):
await page.screencast.start({
  path: "video.webm",
  size: { width: 1280, height: 800 },
  quality: 90
});
Turn on action labels that highlight whatever we click or type and show a small caption. It returns a "disposable" we can use to turn the labels off again. The defaults are a 500ms caption, 24px font, top-right corner:
await page.screencast.showActions({ position: "top-right" });
// ... later ...
await page.screencast.hideActions();
position can be any of "top-left", "top", "top-right", "bottom-left", "bottom", or "bottom-right", so we can place the labels in whichever corner or edge stays out of the way. The same three options (position, duration, fontSize) also work on the show block in the config file.
To process frames ourselves, for a thumbnail, a live preview, or to feed an AI vision model, we pass an onFrame callback, and Playwright sends us JPEG frames as they happen, along with the viewport size:
await page.screencast.start({
  onFrame: ({ data, viewportWidth, viewportHeight }) => {
    sendToVisionModel(data); // data is a Buffer holding one JPEG frame
  },
  size: { width: 800, height: 600 },
});
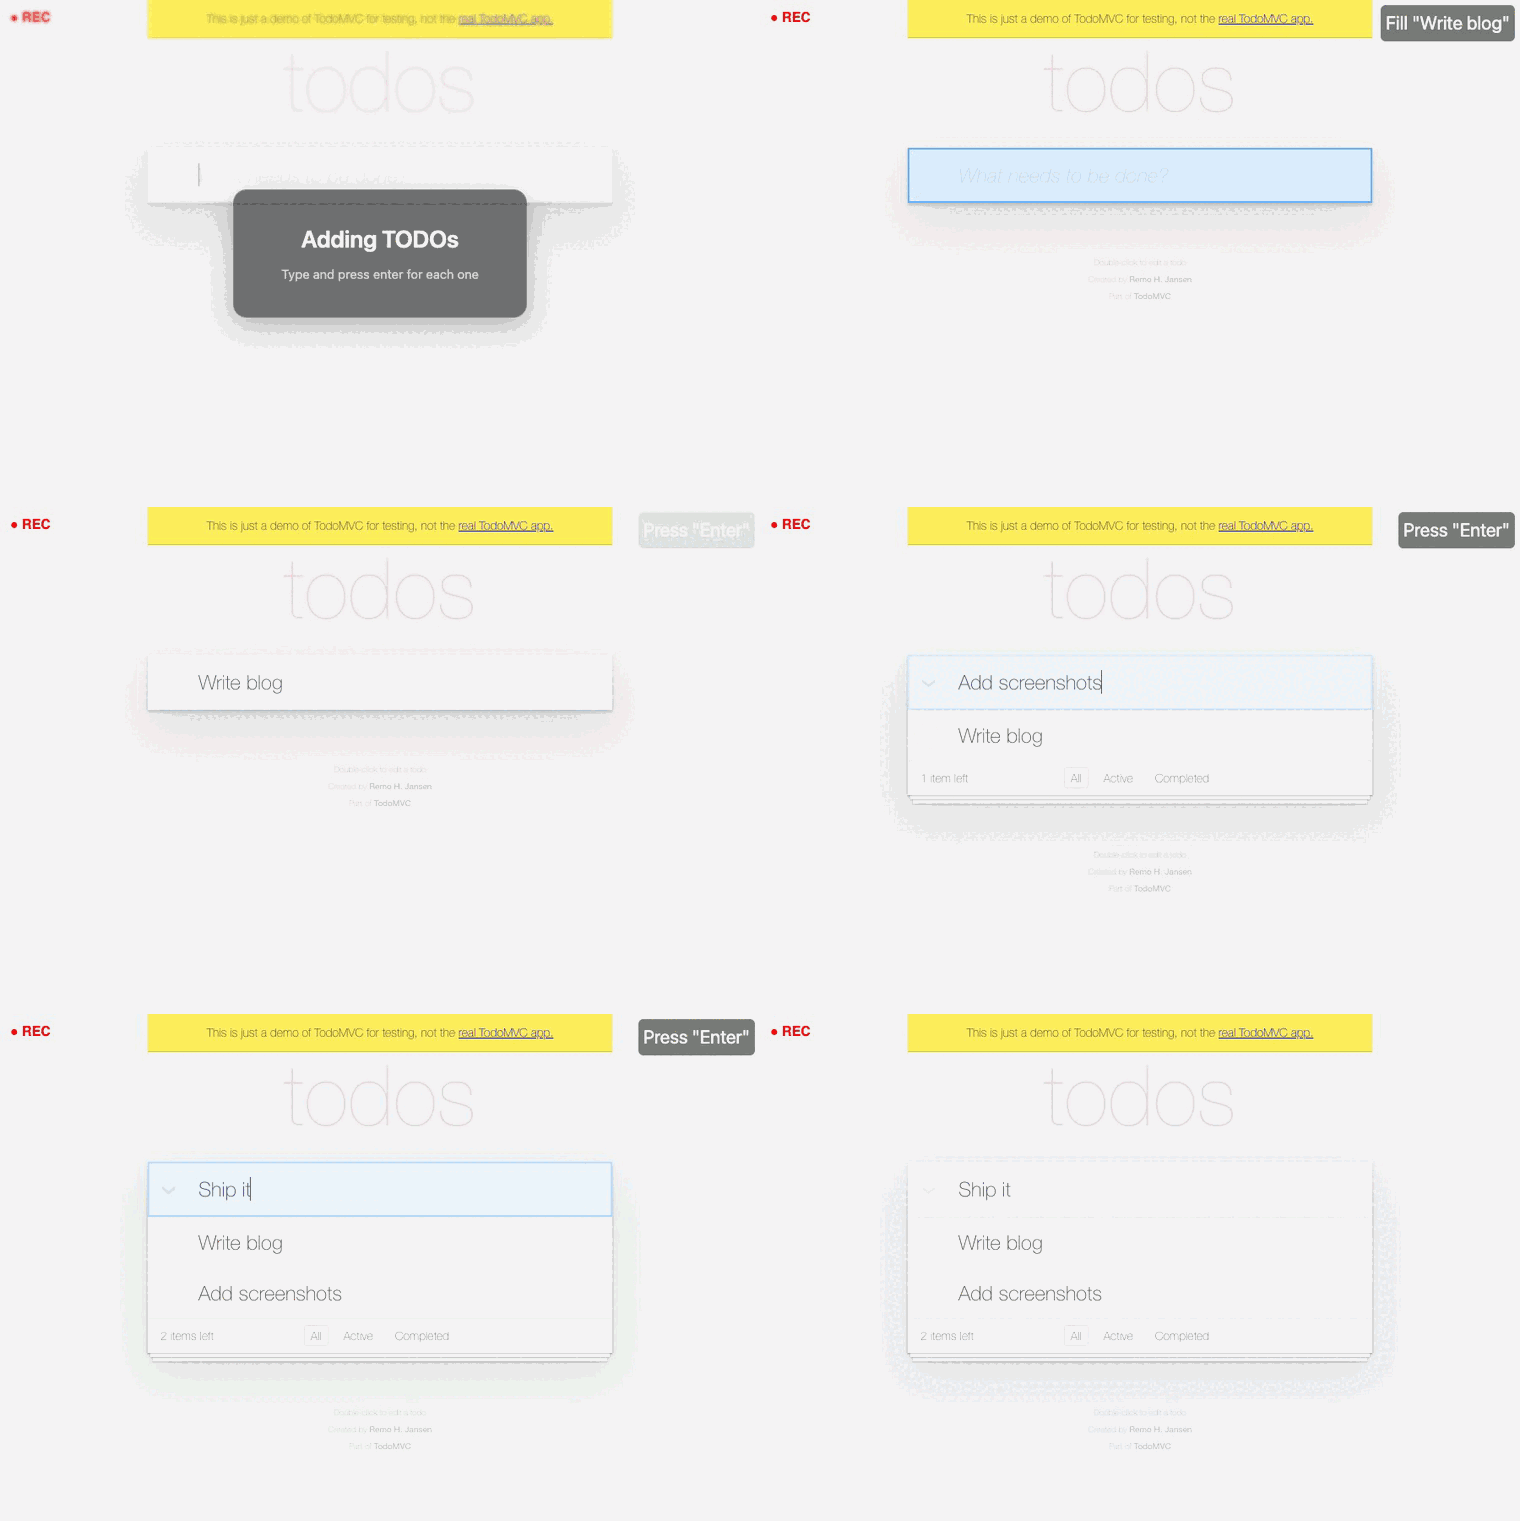
We can also add chapter cards and custom overlays to the recording. A chapter card shows up in the middle of the screen with a blurred background and disappears after a couple of seconds (default 2000ms); an overlay is any HTML we want and stays until we remove it:
await page.screencast.showChapter("Adding TODOs", {
  description: "Type and press enter for each one",
  duration: 1000,
});

await page.screencast.showOverlay('<div style="color:red">● Recording</div>');
If we don't want to add this to every test, we can turn action labels on for the whole suite from our config file (more on config below):
// playwright.config.ts
export default defineConfig({
  use: {
    video: {
      mode: "on",
      show: {
        actions: { position: "top-left" },
        test: { position: "top-right" },
      },
    },
  },
});
Note: chapter cards, overlays, and action labels only show up in the recorded video. They are not part of the page itself, so a
page.screenshot()taken during a chapter won't capture them. There's also apage.screencast.on('screencastFrame', ...)event if we prefer events over theonFramecallback.
Putting it all together, here's a complete run that uses every option and records a walkthrough of TodoMVC into receipt.webm:
import { test, expect } from "@playwright/test";

test.use({ viewport: { width: 900, height: 600 } });

test("record a screencast receipt", async ({ page }) => {
  // start(): path + size + quality
  await page.screencast.start({
    path: "receipt.webm",
    size: { width: 900, height: 600 },
    quality: 90,
  });
  // showActions(): position + duration + fontSize
  await page.screencast.showActions({ position: "top-right", duration: 800, fontSize: 22 });

  await page.goto("https://demo.playwright.dev/todomvc/");

  // showOverlay(): any HTML, pinned to the video until disposed
  await using rec = await page.screencast.showOverlay(
    '<div style="position:fixed;top:12px;left:12px;color:#e11;font:600 16px sans-serif">● REC</div>'
  );

  // showChapter(): title + description + duration
  await page.screencast.showChapter("Adding TODOs", {
    description: "Type and press enter for each one",
    duration: 1200,
  });

  const box = page.getByPlaceholder("What needs to be done?");
  for (const todo of ["Write blog", "Add screenshots", "Ship it"]) {
    await box.fill(todo);
    await box.press("Enter");
  }

  await expect(page.getByTestId("todo-title")).toHaveCount(3);
  await page.screencast.stop(); // writes receipt.webm
});
browser.bind() makes a running browser available for other tools, Playwright's CLI, the MCP server, or another script, to connect to. This is what lets an AI agent drive a browser we already have open.
const { endpoint } = await browser.bind("my-session", {
  workspaceDir: "/my/project",
});
Now other tools can attach to the same browser, and more than one at a time is fine:
playwright-cli attach my-session
@playwright/mcp --endpoint=my-session
// or connect from code using the endpoint we got back
const browser = await chromium.connect(endpoint);By default this uses a named pipe. To use a WebSocket instead, we pass host and port and the endpoint comes back as a ws:// URL. Call browser.unbind() when we want to stop letting new tools connect.
Run playwright-cli show to open a dashboard that lists every bound browser, shows its status, and lets us step in, take over a session by hand, or open DevTools to inspect it. playwright-cli connects all of its browsers automatically, and setting PLAYWRIGHT_DASHBOARD=1 also shows our @playwright/test browsers there.
Bind a browser, then open the dashboard from a second terminal:
// bind.js — run with `node bind.js`
const { chromium } = require("@playwright/test");
(async () => {
  const browser = await chromium.launch({ headless: false });
  const { endpoint } = await browser.bind("todo-session", { workspaceDir: process.cwd() });
  const page = await browser.newPage();
  await page.goto("https://demo.playwright.dev/todomvc/");
  await page.getByPlaceholder("What needs to be done?").fill("Write blog");
  await page.getByPlaceholder("What needs to be done?").press("Enter");
  console.log("Bound at", endpoint, "— leave this running.");
})();
npx playwright-cli show # in a second terminal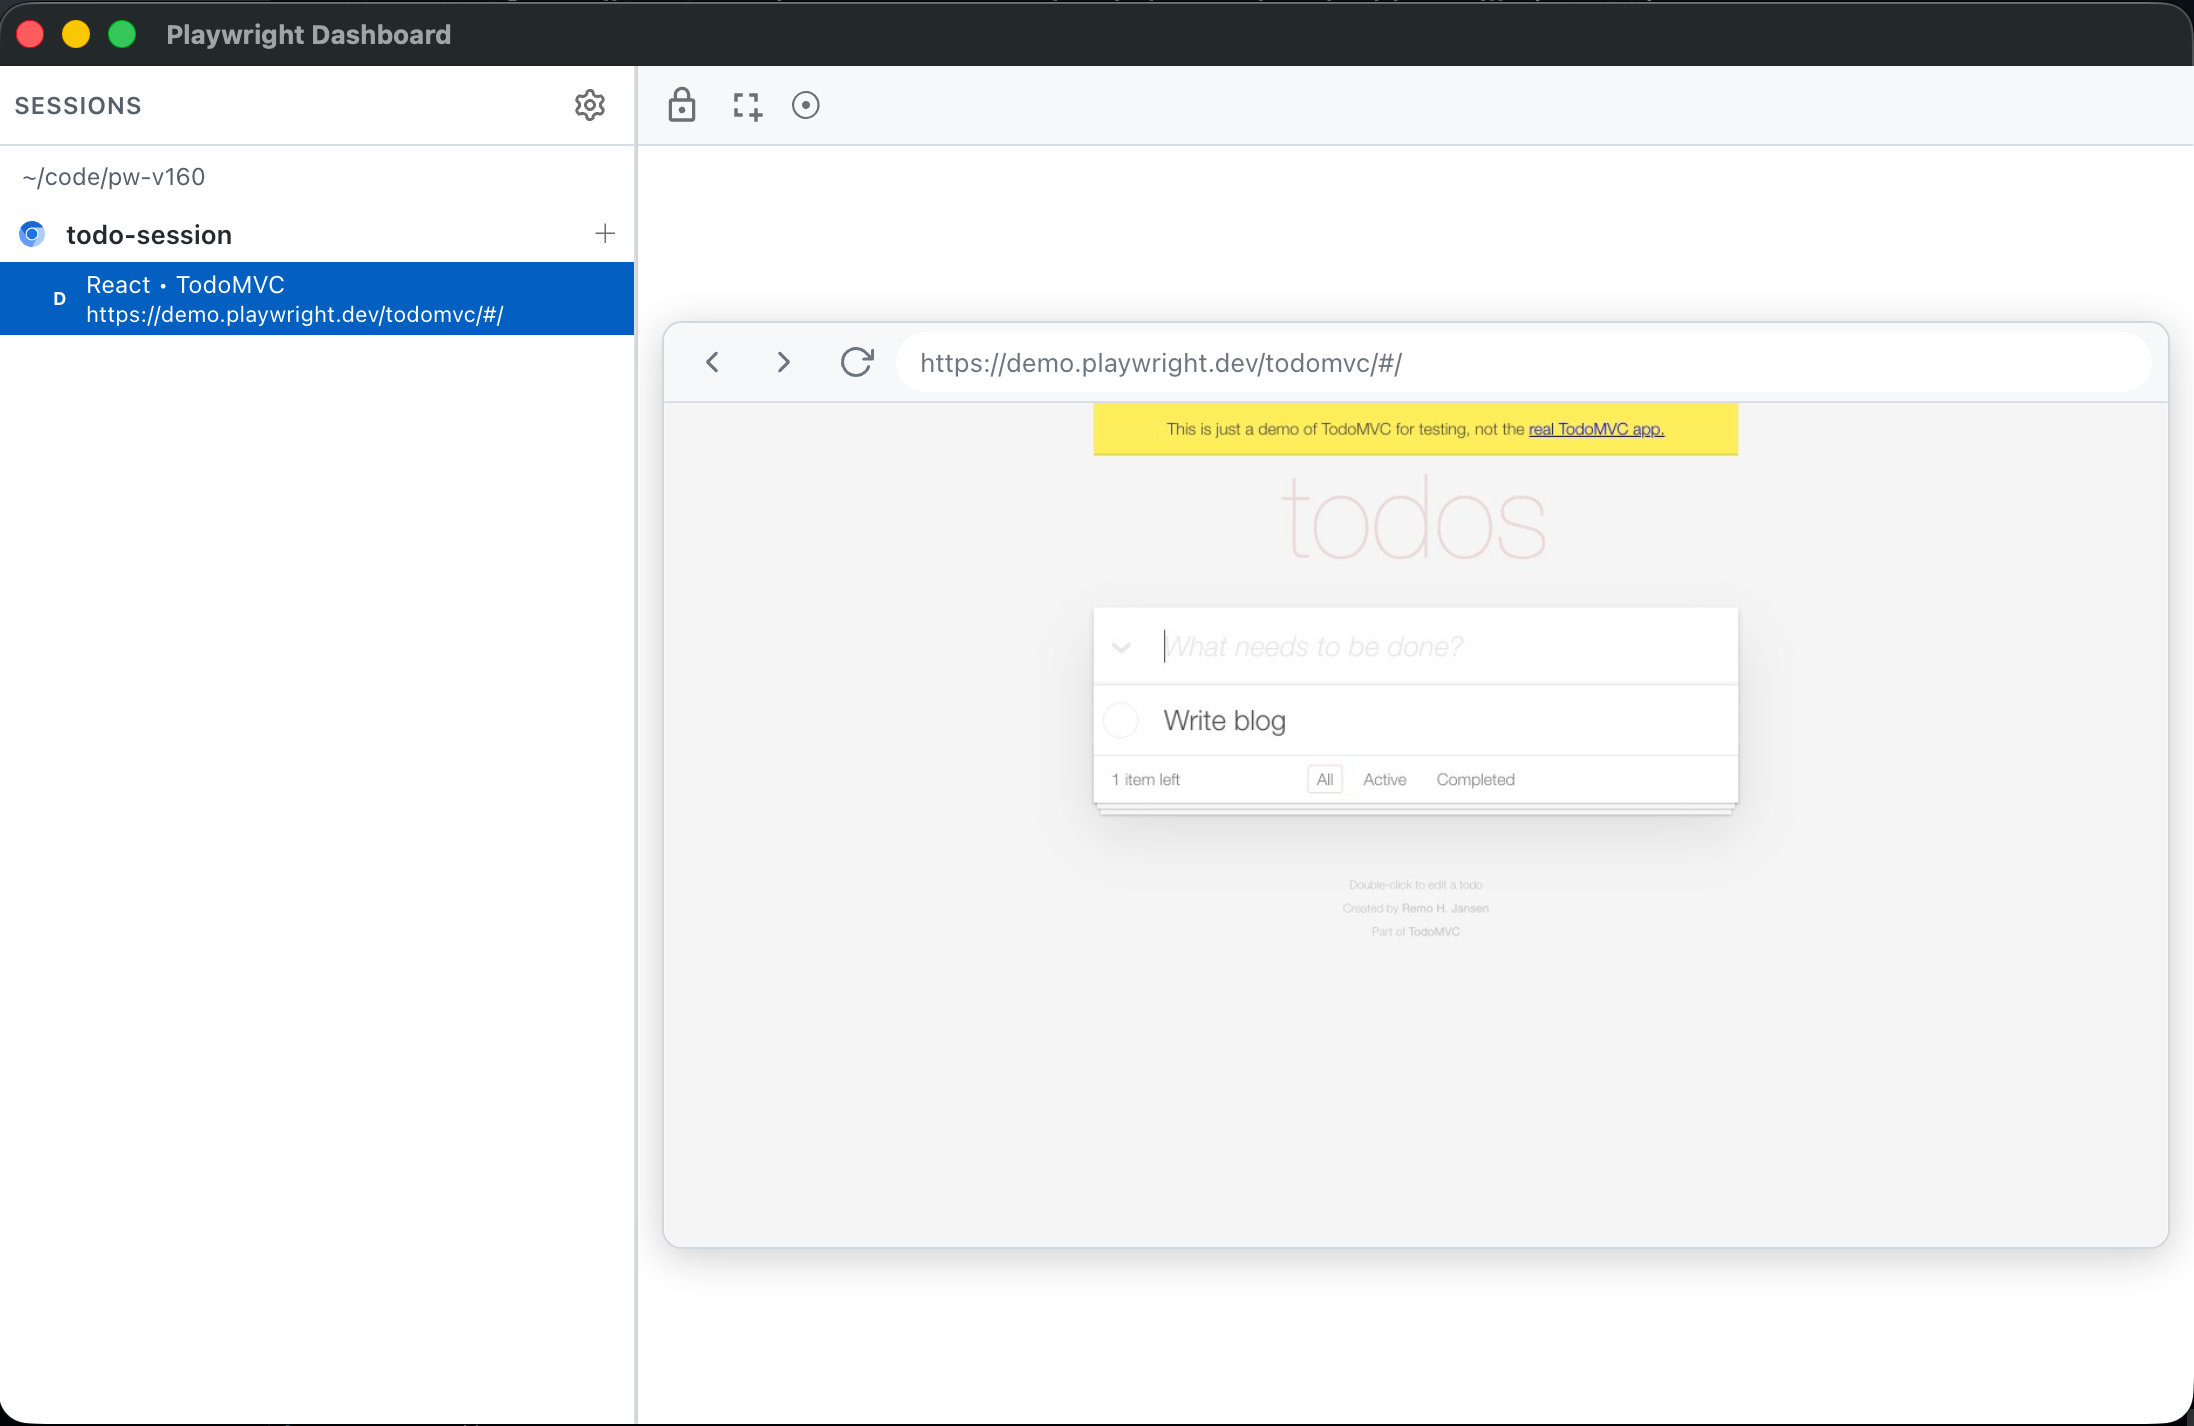
We (and agents) can now attach to a running test straight from the terminal, no UI needed:
npx playwright test tests/example.spec.ts --debug=cli
# it prints a "playwright-cli attach ..." command to run in another terminal
playwright-cli attach tw-87b59e
playwright-cli --session tw-87b59e step-over
We can also inspect a trace from the terminal, list the actions, open one, and read its before/after page snapshot:
npx playwright test tests/example.spec.ts --trace on
npx playwright trace open test-results/*/trace.zip
npx playwright trace actions --grep="expect"
npx playwright trace action 9
npx playwright trace snapshot 9 --name after
It's the same trace we'd open in the Trace Viewer, just turned into text an agent can read.
Many Playwright calls now return a "disposable." Pair them with JavaScript's await using and they clean themselves up when the block ends, no need to remember to call unroute or removeInitScript:
import { test } from "@playwright/test";

test("route disposes at the end of the block", async ({ page }) => {
  {
    await using route = await page.route("**/*.png", r => r.abort()); // images blocked
    await page.goto("https://demo.playwright.dev/todomvc/");
  }
  // route is removed here, automatically — images load again
  await page.goto("https://demo.playwright.dev/todomvc/");
});Snapshots and locators
page.ariaSnapshot()gets the accessibility snapshot of the whole page (same aspage.locator('body').ariaSnapshot()).locator.ariaSnapshot()now also takesdepthandmode.locator.normalize()rewrites a locator to follow best practices (test ids, roles).page.pickLocator()/page.cancelPickLocator(), hover to highlight an element and get its locator back, right from our script.
Storage, console, and errors
browserContext.setStorageState()clears cookies, local storage, and IndexedDB and sets a new state, all in place, no need to build a fresh context.page.clearConsoleMessages()/page.clearPageErrors()clear what Playwright has stored, andconsoleMessages()/pageErrors()take afilteroption. Console messages now also carry atimestamp().
Miscellaneous
browserContext.debuggerlets us control the debugger from code (more on this below).browserContext.isClosed(),request.existingResponse(),response.httpVersion().CDPSessionnow emitseventandclose.tracing.start()takes aliveoption for real-time trace updates.browserType.launch()takes anartifactsDirto choose where artifacts go.
While reading the v1.59 type definitions, we found several additions the changelog never mentions:
URLPatternworks everywhere. These calls already accepted three ways to match a URL, a glob string, aRegExp, or a predicate function(url) => boolean. v1.59 adds a fourth option: the web-standardURLPattern, acrosspage.route(),page.unroute(),page.routeWebSocket(),page.waitForURL(),page.waitForRequest()/waitForResponse(), andexpect(page).toHaveURL(). Nothing is removed, the old forms still work;URLPatternjust lets us match with named parts (:section,:id) instead of a hand-written regex:
  test("matches with URLPattern", async ({ page }) => {
    await page.goto("https://playwright.dev/docs/intro");
    // before: a regex like /\/docs\/[^/]+$/ or a predicate
    // now: named and readable
    await expect(page).toHaveURL(new URLPattern({ pathname: "/docs/:section" }));
  });
Those disposables that make
await usingwork.page.route(),page.exposeFunction(),page.exposeBinding(), andpage.addInitScript()now return a disposable, the notes show theawait usingpattern but never say which calls actually support it.ariaSnapshot({ mode: "ai" }). Besidesdepth, the snapshot takes amodeof"ai"or"default"."ai"gives us a version made for feeding to an AI model;"default"is the YAML we already know.A full step-by-step debugger:
browserContext.debugger. The notes call it "programmatic control over the debugger" and leave it there. It's actually a full stepping API,requestPause(),resume(),next(),runTo(location),pausedDetails(), and apausedstatechangedevent, the same parts the new--debug=climode is built on.toMatchAriaSnapshot({ children })lets us control how strictly children must match:"contain","equal", or"deep-equal".
Action labels in recorded videos. The
videooption in our config now takes ashowblock:
  use: {
    video: {
      mode: "on",
      size: { width: 1280, height: 720 },
      show: {
        actions: { position: "top-left", duration: 500, fontSize: 24 },
        test: { level: "step", position: "top-right", fontSize: 24 },
      },
    },
  }
actions labels each interaction; test labels the current test, its level can be "file", "title", or "step". mode is the usual video mode: "off", "on", "retain-on-failure", or "on-first-retry".
A new trace mode:
trace: "retain-on-failure-and-retries"records a trace for every attempt and keeps them all when one fails, perfect for comparing a passing run against a failing flaky one. It joins the existing"on","off","on-first-retry","on-all-retries", and"retain-on-failure"modes.JUnit reporter
includeRetries. The JUnit reporter can now include retry attempts in its output.Pick where launch artifacts go: set
artifactsDirunderlaunchOptions.
UI Mode can filter to just the tests affected by our recent code changes.
The HTML report can filter test steps and shows the other runs from the same worker.
WebKit no longer supports macOS 14, upgrade macOS or pin an older Playwright.
The
@playwright/experimental-ct-sveltepackage was removed.The JUnit reporter now tells error types apart, so some things previously reported as
<failure>now show up as<error>.
A quick patch:
[Windows] Reverted a change that hid the console window when starting browsers, which had broken
codegen,--ui, andshow.
tracing.startHar() / tracing.stopHar() make HAR recording part of tracing. It takes the same options as the old recordHar: content ("omit", "embed", or "attach"), mode ("full" or "minimal"), urlFilter, and resourcesDir (where response bodies go when we use content: "attach"). Because it returns a disposable, we can capture a HAR around just one part of a test instead of setting it up when we build the context:
import { test } from "@playwright/test";

test("capture a HAR slice", async ({ context }) => {
  await using har = await context.tracing.startHar("todo.har");
  const page = await context.newPage();
  await page.goto("https://demo.playwright.dev/todomvc/");
  // todo.har is written when `har` goes out of scope
});
To inspect every request it captured, open todo.har in Chrome DevTools, the Network panel accepts a HAR file via drag-and-drop (or the "Import HAR file…" button), or drop it into the Google HAR Analyzer.
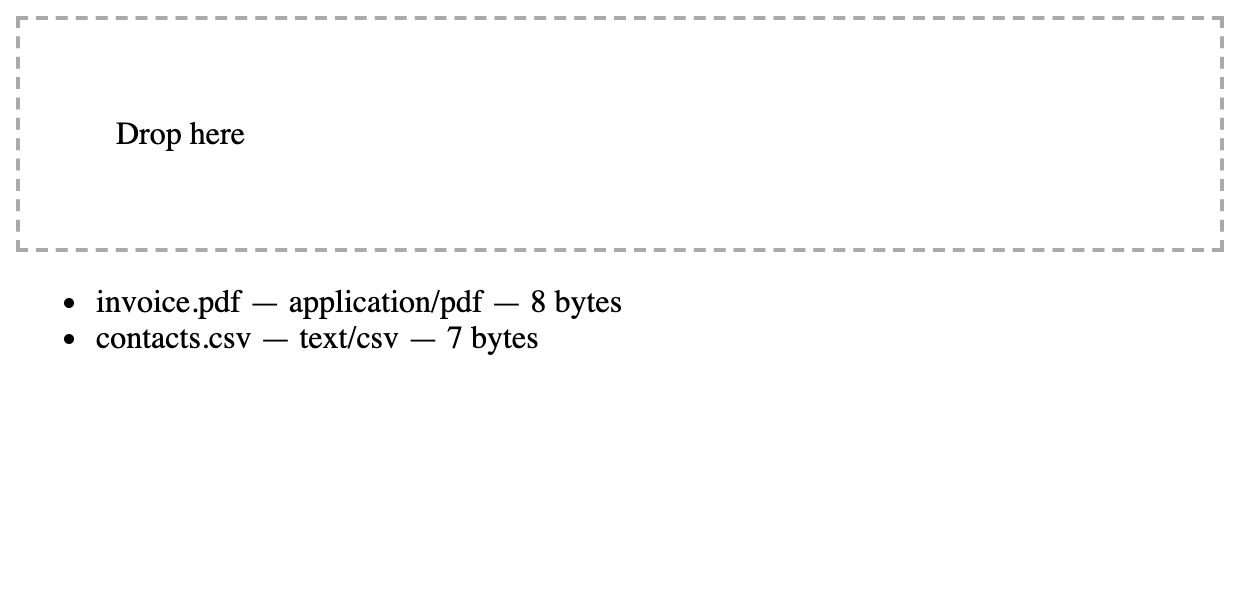
locator.drop() simulates dragging something onto an element from outside the browser, like dropping a file in from the file manager. That's something the old dragTo() couldn't do. Internally, Playwright fires the real dragenter, dragover, and drop events with a proper DataTransfer, so it works in every browser and is great for testing upload zones.
Besides files, drop() can carry typed data, text, links, or custom MIME types:
await page.getByTestId("dropzone").drop({
  data: {
    "text/plain": "hello world",
    "text/uri-list": "https://example.com",
  },
});
Note: unlike most actions,
drop()'stimeoutdefaults to0, meaning no timeout. If our target might not be on the page yet, we pass atimeoutso we get a clear error instead of it hanging. There's also apositionoption to aim at a specific spot inside the element.
Putting it all together, TodoMVC has no upload zone, so we build a tiny inline page. This writes drop.png:
import { test, expect } from "@playwright/test";

test.use({ viewport: { width: 620, height: 300 }, deviceScaleFactor: 2 });

test("drop files onto a zone", async ({ page }) => {
  await page.setContent(`
    <div id="dropzone" data-testid="dropzone" style="border:2px dashed #aaa;padding:48px">Drop here</div>
    <ul id="files" data-testid="files"></ul>
    <script>
      const dz = document.getElementById('dropzone');
      dz.addEventListener('dragover', e => e.preventDefault());
      dz.addEventListener('drop', e => {
        e.preventDefault();
        for (const f of e.dataTransfer.files) {
          const li = document.createElement('li');
          li.textContent = f.name + ' — ' + f.type + ' — ' + f.size + ' bytes';
          document.getElementById('files').appendChild(li);
        }
      });
    </script>`);
  await page.getByTestId("dropzone").drop({
    files: [
      { name: "invoice.pdf", mimeType: "application/pdf", buffer: Buffer.from("%PDF-1.4") },
      { name: "contacts.csv", mimeType: "text/csv", buffer: Buffer.from("a,b\n1,2") },
    ],
  });
  await expect(page.getByTestId("files").locator("li")).toHaveCount(2);
  await page.screenshot({ path: "drop.png" });
});
test.abort() immediately fails the running test with an optional message. It works from a fixture, a hook, or a route handler, and it throws, nothing after it runs. We reach for it when we spot something that should never happen and want to fail right away instead of continuing, with our own message in the report instead of a generic timeout:
import { test } from "@playwright/test";

test("abort on a forbidden request", async ({ page }) => {
  await page.route("**/publish", route => {
    test.abort("Tests must not publish to the shared page.");
    return route.abort();
  });
  await page.goto("https://demo.playwright.dev/todomvc/");
  await page.evaluate(() => fetch("/publish", { method: "POST" }).catch(() => {}));
});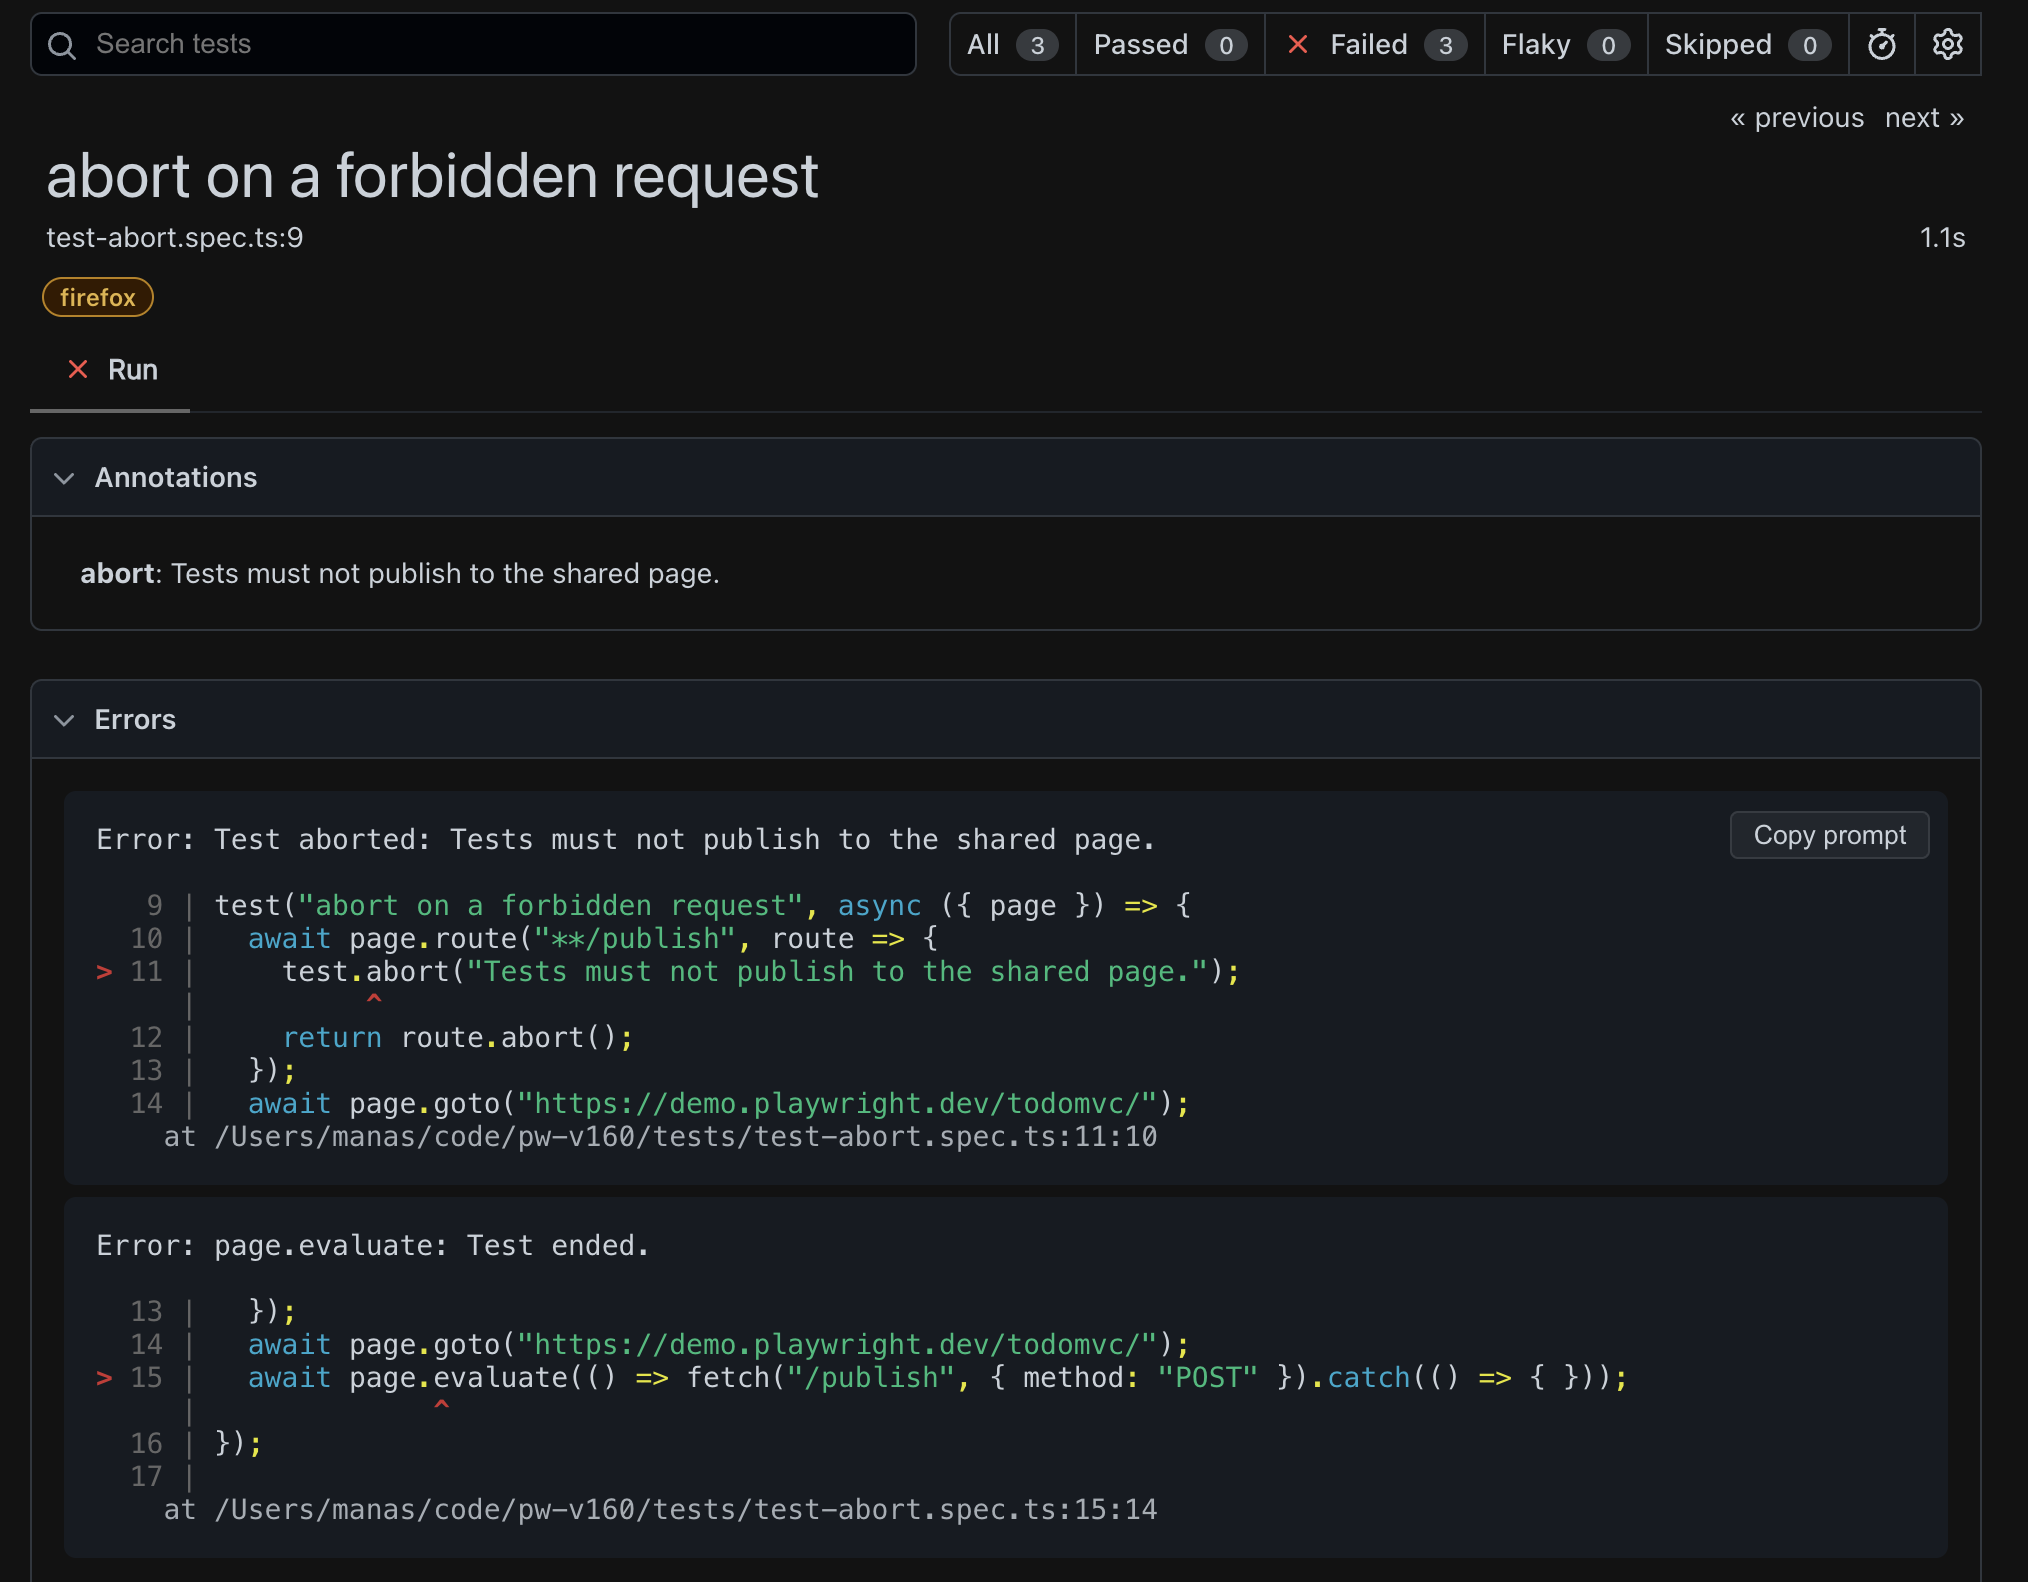
Since abort() fails the test, this run is meant to show up red, that's the whole point. If we want to keep it in a green suite (a demo, or a test that proves the abort path fires), we add test.fail() at the top of the test to mark it expected-to-fail, which turns that intentional failure into a pass.
This is different from test.skip() and test.fixme(), which mark a test as skipped, abort() fails it, and test.fail() just records that the failure was expected.
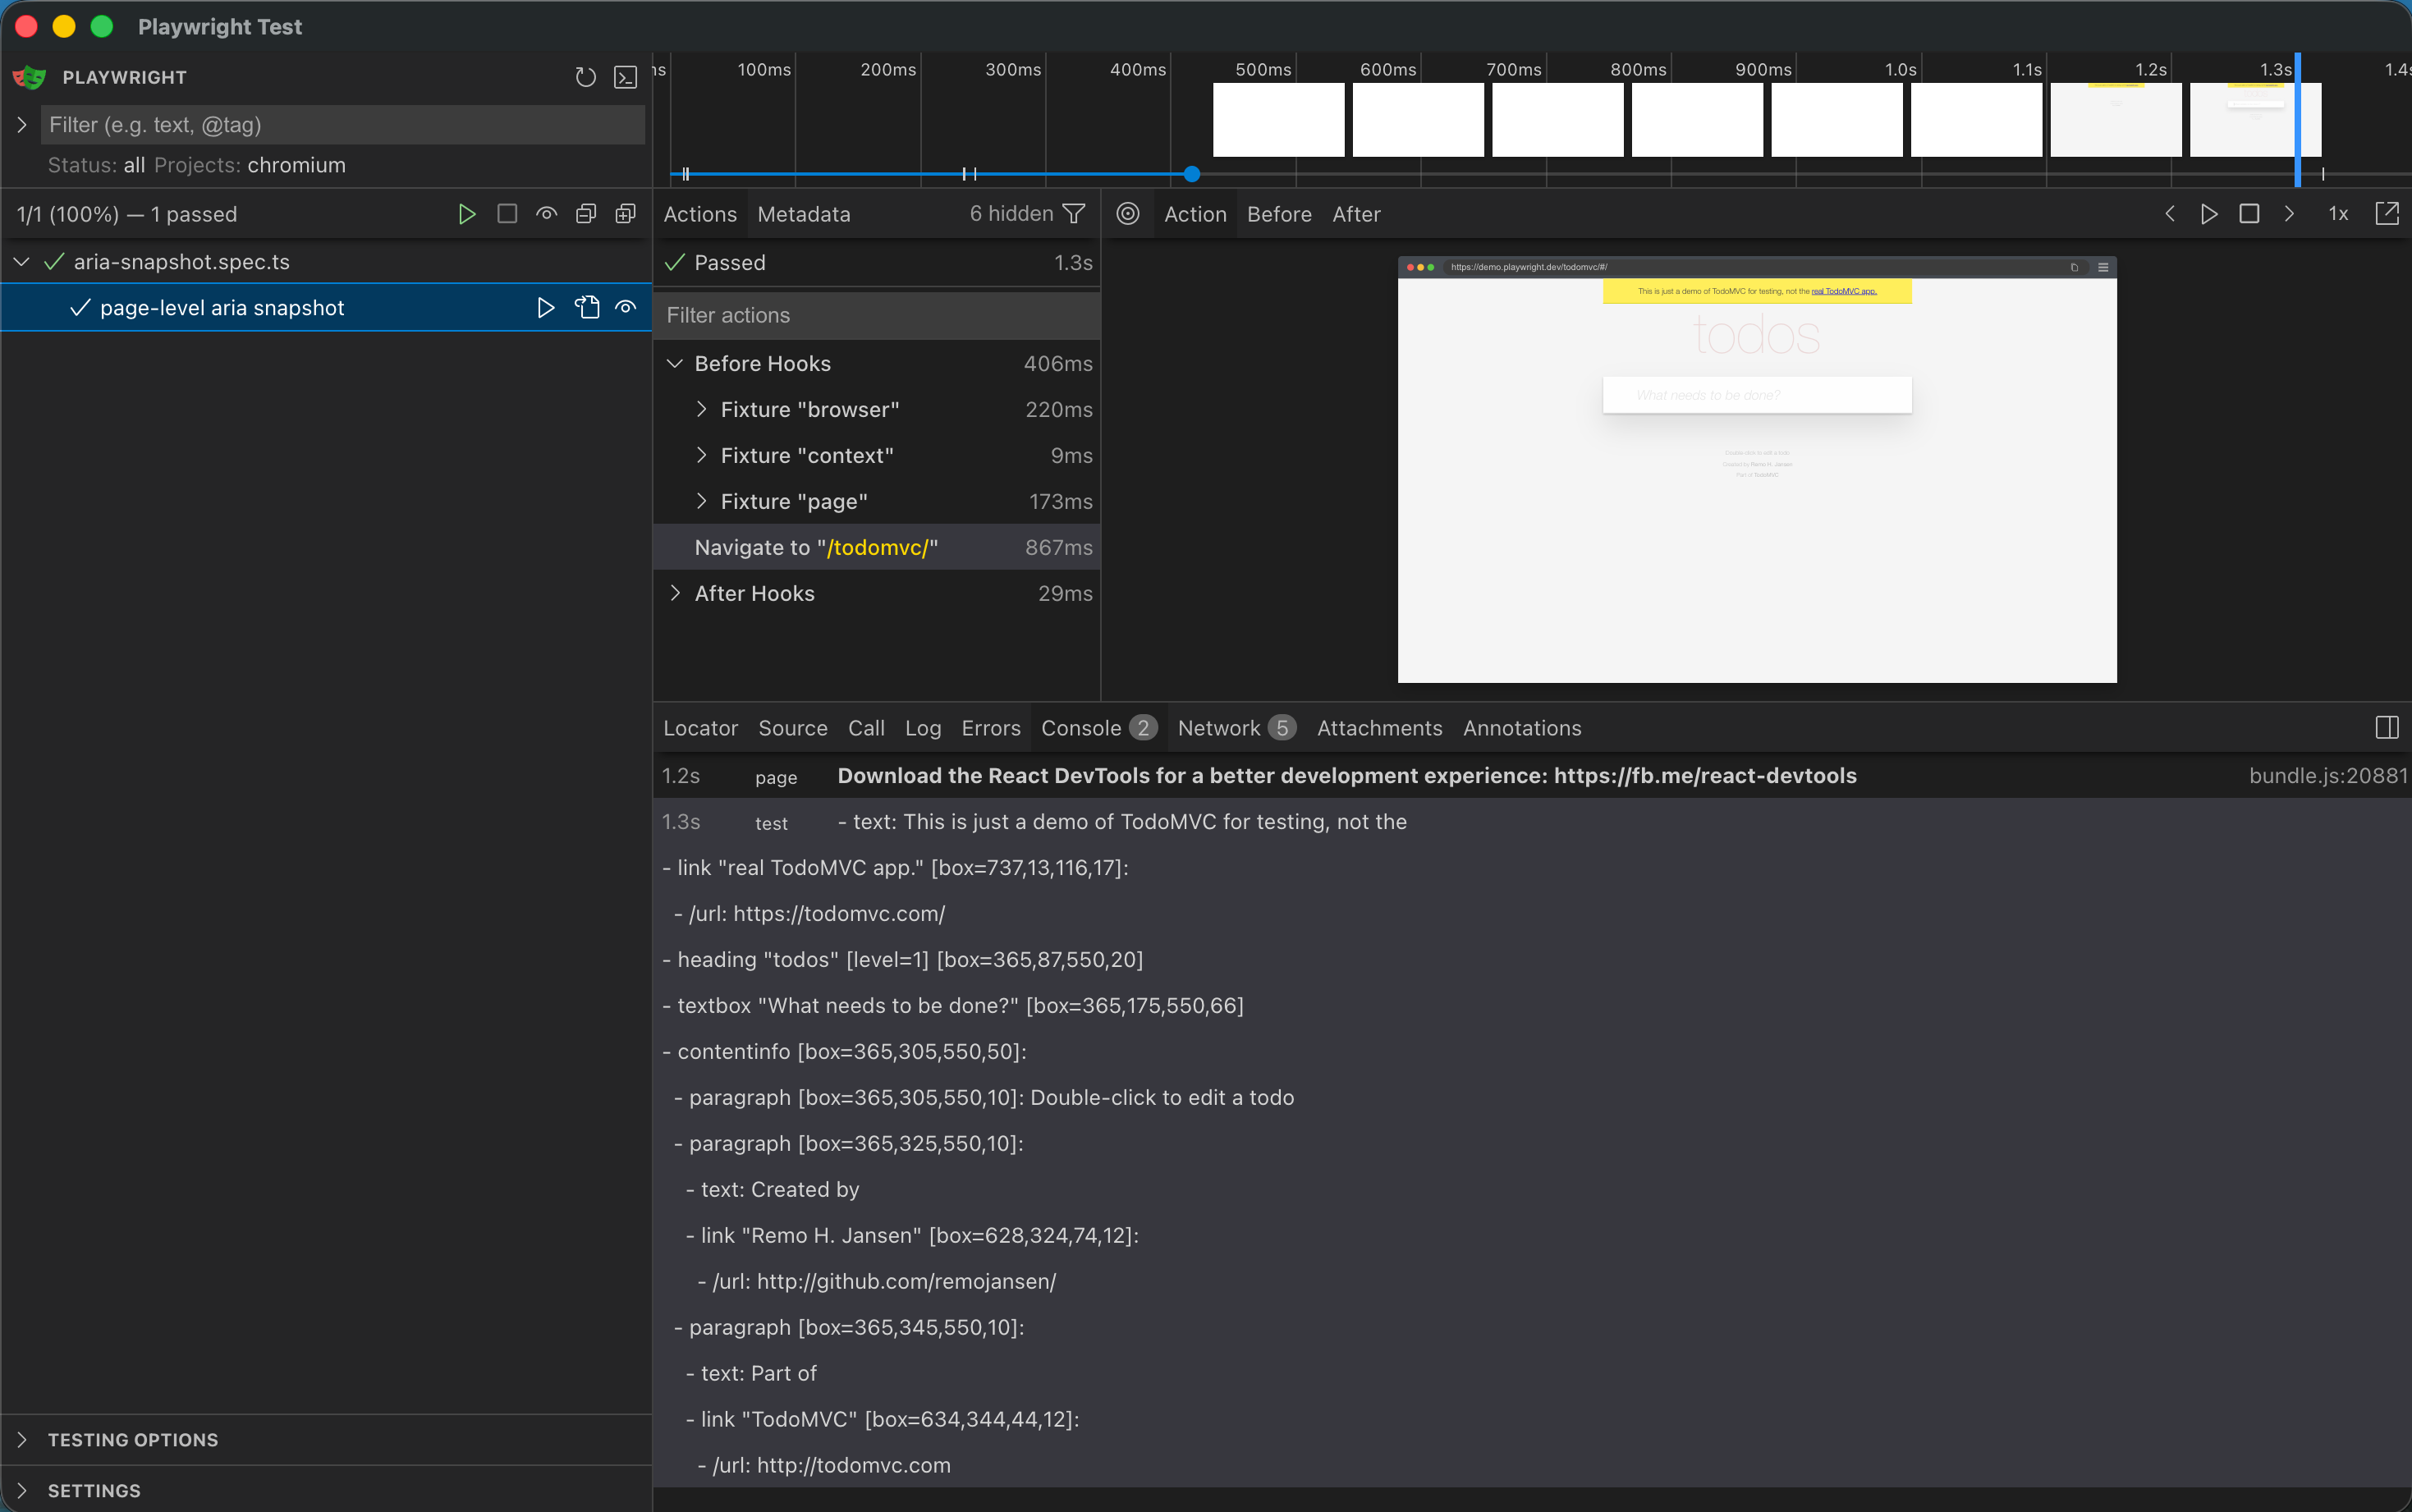
expect(page).toMatchAriaSnapshot() now works on a whole Page, not just a locator (it's the same as checking page.locator('body')), and a new boxes option adds each element's position and size to the snapshot as [box=x,y,width,height], useful when passing snapshots to an AI:
import { test } from "@playwright/test";

test("page-level aria snapshot", async ({ page }) => {
  await page.goto("https://demo.playwright.dev/todomvc/");
  console.log(await page.ariaSnapshot({ boxes: true })); // each node gets [box=x,y,width,height]
});
browser.on('context')fires whenever a new context is created.A context now mirrors its pages' events:
download,frameattached,framedetached,framenavigated,pageclose,pageload.getByRole()takes adescriptionoption (a string or a regex) to match an element's accessible description.expect(locator).toHaveCSS()takes apseudooption,"before"or"after", to read styles from those pseudo-elements.webSocketRoute.protocols()returns the WebSocket subprotocols the page asked for.connectOverCDP()takes anoDefaultsoption so attaching to our everyday browser doesn't change its downloads, focus, or media settings.consoleMessage.location()now exposeslineandcolumn(lineNumber/columnNumberare deprecated), and there's a matchingwebError.location().testInfoError.errorContextcarries extra debugging info, for example, the accessibility snapshot at the moment anexpectfailed.reporter.onError()now also gets aworkerInfo.
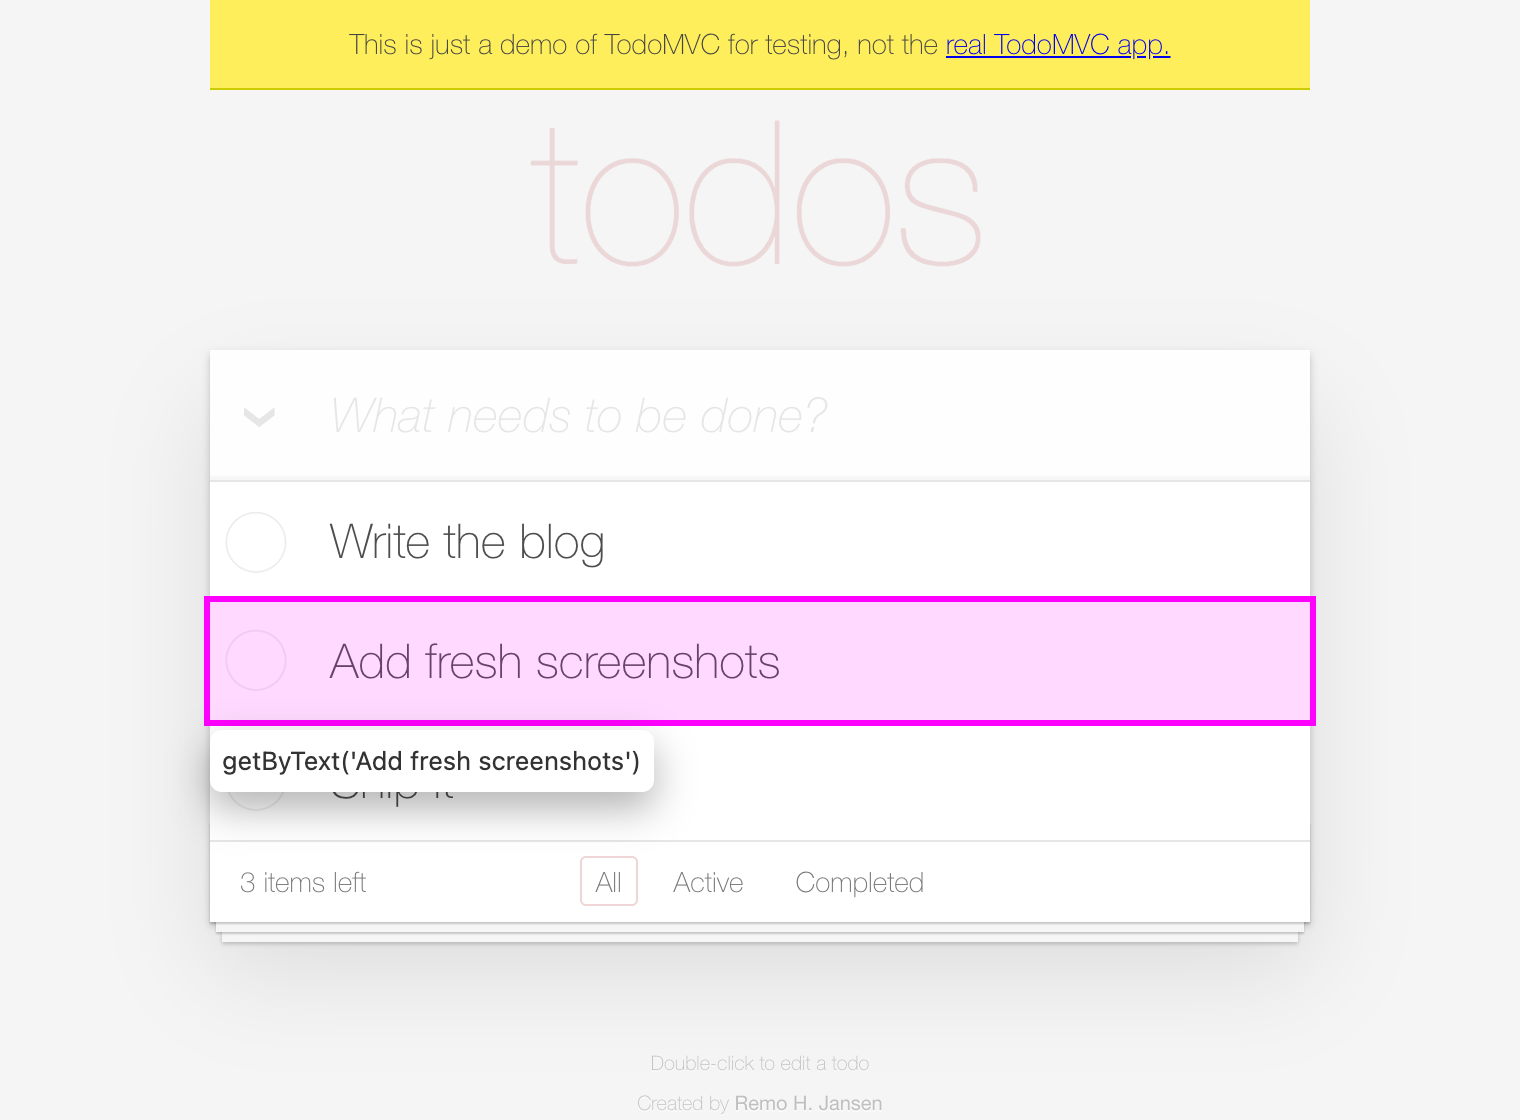
locator.highlight() now takes a style option so we can draw a custom overlay on the page, and page.hideHighlight() clears every highlight. Running this writes highlight.png, the image below:
import { test } from "@playwright/test";

test.use({ viewport: { width: 760, height: 560 }, deviceScaleFactor: 2 });

test("highlight a todo with a custom style", async ({ page }) => {
  await page.goto("https://demo.playwright.dev/todomvc/");
  const box = page.getByPlaceholder("What needs to be done?");
  for (const todo of ["Write the blog", "Add fresh screenshots", "Ship it"]) {
    await box.fill(todo);
    await box.press("Enter");
  }
  await page
    .getByText("Add fresh screenshots")
    .highlight({ style: "outline: 3px solid magenta; background: rgba(255,0,255,0.15)" });
  await page.screenshot({ path: "highlight.png" });
  // await page.hideHighlight(); // clears every highlight
});
Smaller HTML reports: set
doNotInlineAssets: trueon the HTML reporter to stop embedding traces and screenshots into the report HTML, this makes much smaller files when we attach big artifacts.
reporter: [["html", { doNotInlineAssets: true }]],npx playwright show-reportaccepts a.zipdirectly, no need to unzip first.A new snapshot-path token,
{testFileBaseName}(the test file name without its extension) forsnapshotPathTemplate.The test runner now errors if a config tries to override a non-option fixture, and it rejects
workers: 0or negative values.
HTML report: steps with attachments buried in child steps now show an indicator on the parent, and
repeatEachIndexappears in the test header when it isn't zero.Trace Viewer adds a pretty-print toggle for JSON and form request/response bodies.
These were deprecated a while back and are now gone.
Locator.ariaRef()returned an internal reference to an element for aria-based lookups. It's gone, so we now use thelocator.ariaSnapshot()pipeline, which is the supported way to capture and reference elements.The
handleoption onexposeBinding()made the bound callback receive a liveJSHandleas its first argument instead of a plain value. It's gone, so we now pass the data we need as serializable values, or reach for a handle separately withpage.evaluateHandle().The
loggeroption onconnect()/connectOverCDP()let us plug in a custom logger for the browser's protocol traffic. It's gone, so we now record a trace and inspect it in the Trace Viewer.The context options
videosPathandvideoSizeset where videos were saved and how big they were. They're gone, so we now use therecordVideooption (recordVideo: { dir, size }) onbrowser.newContext().
While we checked the v1.59 type definitions for this post, we saw that page.screencast.start() still declared an annotate option. That option had a short life. It was added in microsoft/playwright#39783 and replaced by the showActions() API before v1.59.0 shipped microsoft/playwright#39852. The removal deleted annotate from every layer except the generated type definitions. As a result, TypeScript accepts the option and autocompletes it, but the runtime silently ignores it:
await page.screencast.start({
  path: "video.webm",
  annotate: { position: "top-left", fontSize: 30 }, // type-checks, but does nothing
});
So we reported a bug in the Playwright repo: microsoft/playwright#42234. The stale declaration survived because types.d.ts is generated, and the removal missed the Screencast.start() override in utils/generate_types/overrides.d.ts. Each regeneration added the option again. The Playwright team fixed it in microsoft/playwright#42239. The fix will ship in the release after v1.62.1.